Healthcare at a glance
Overview of our healthcare system
Last updated 11 March 2026
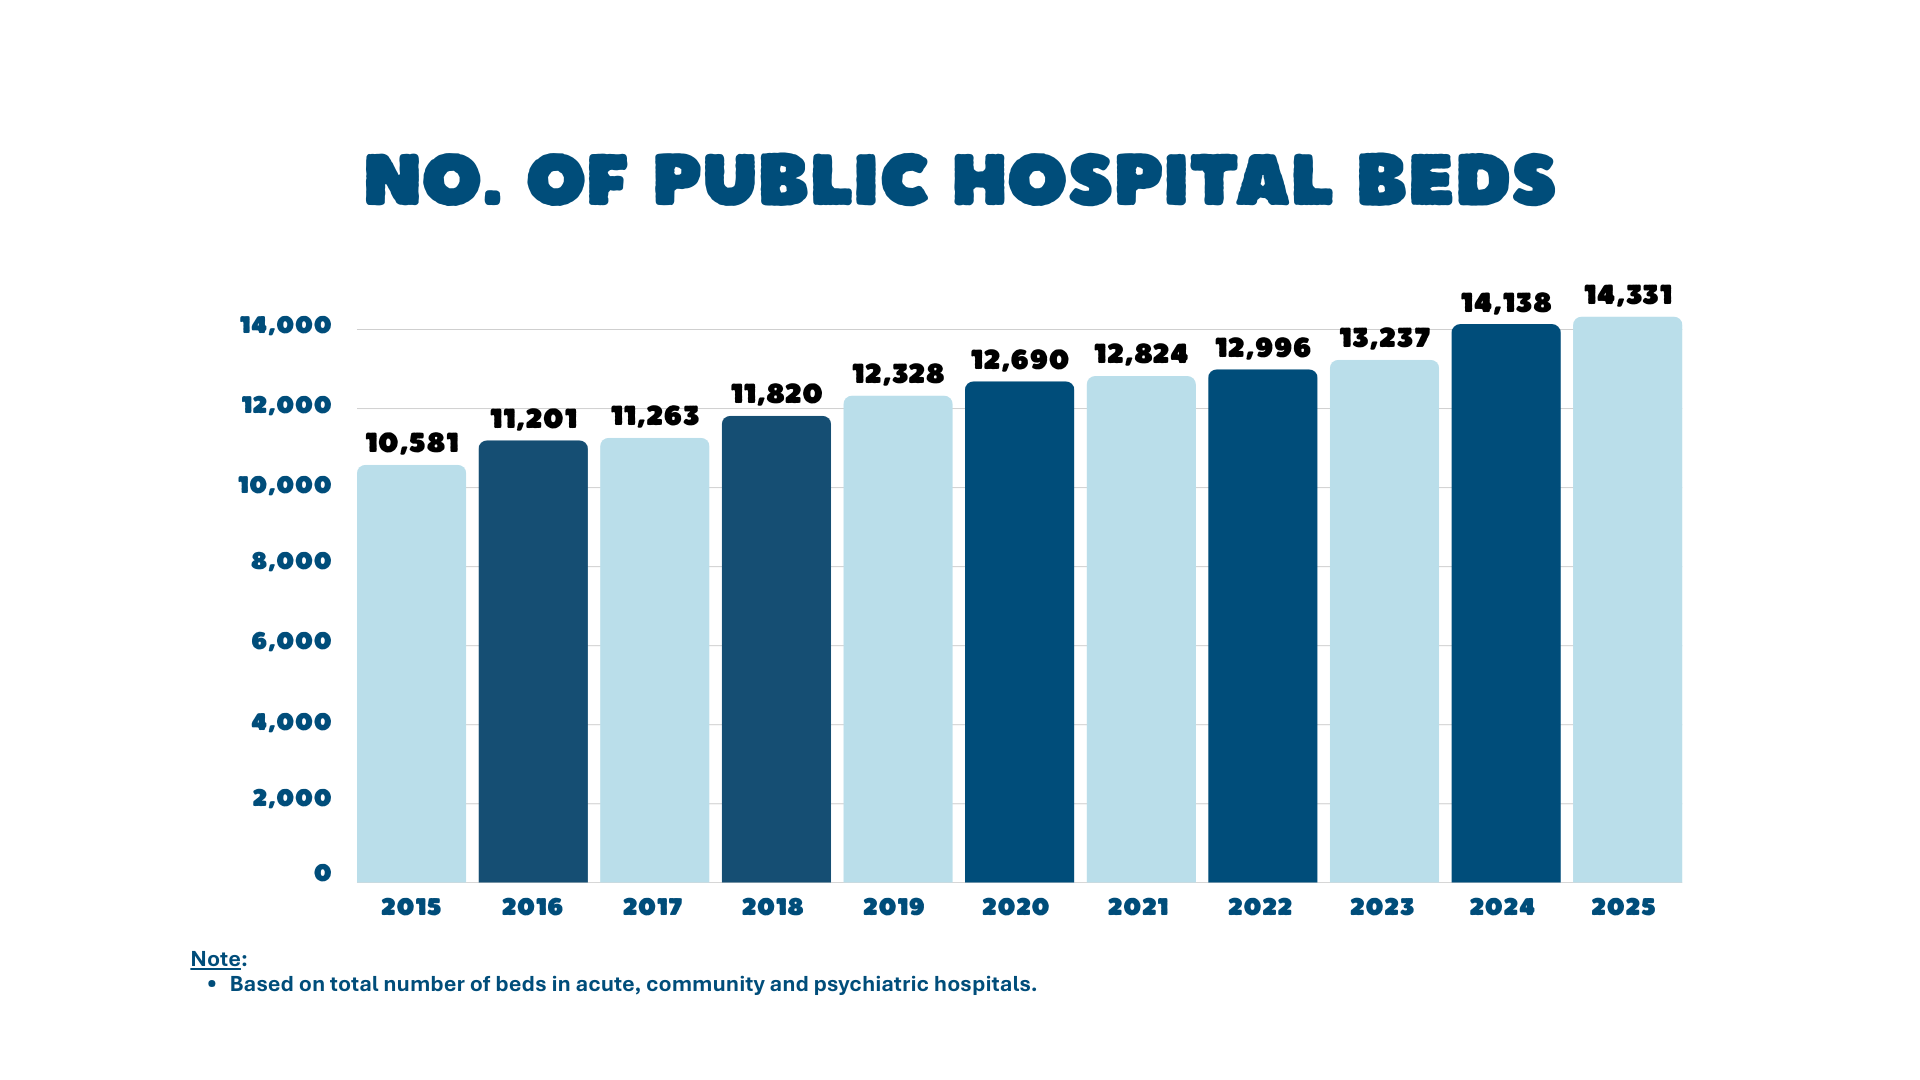
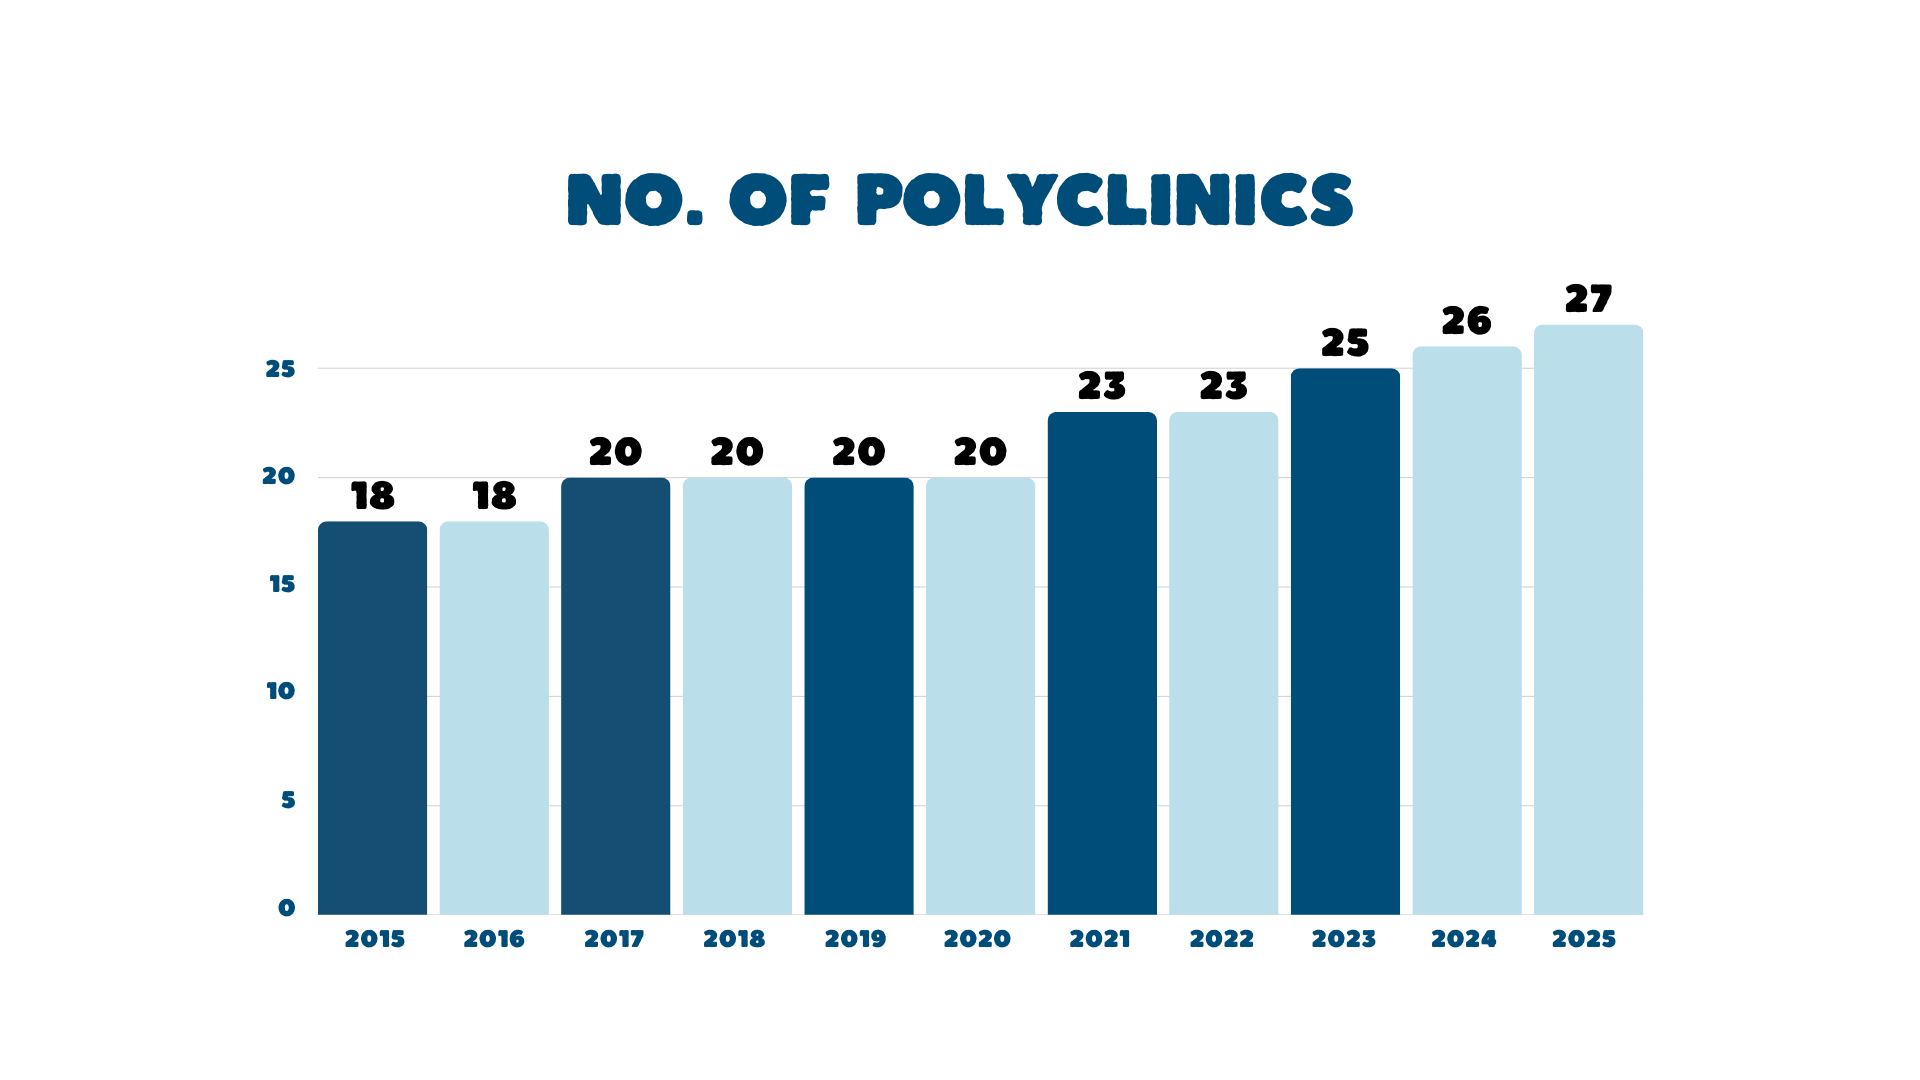
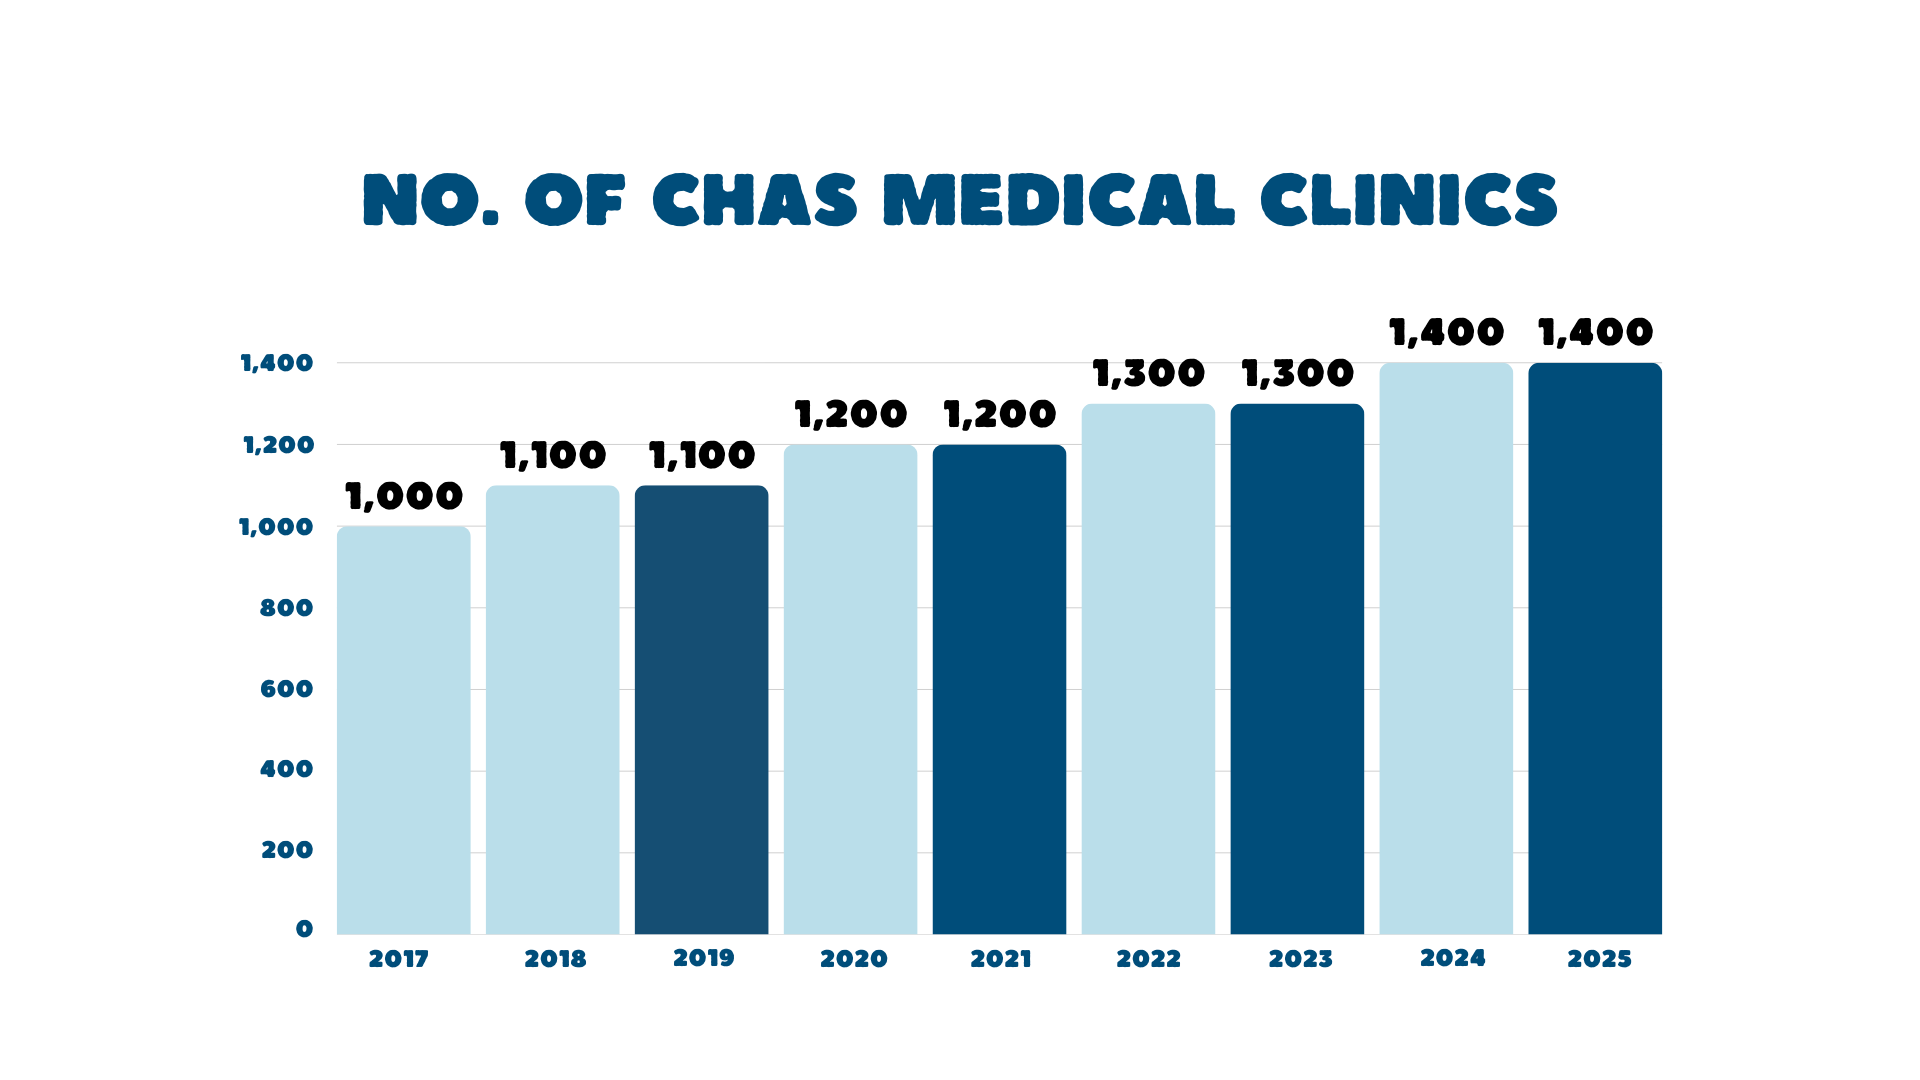
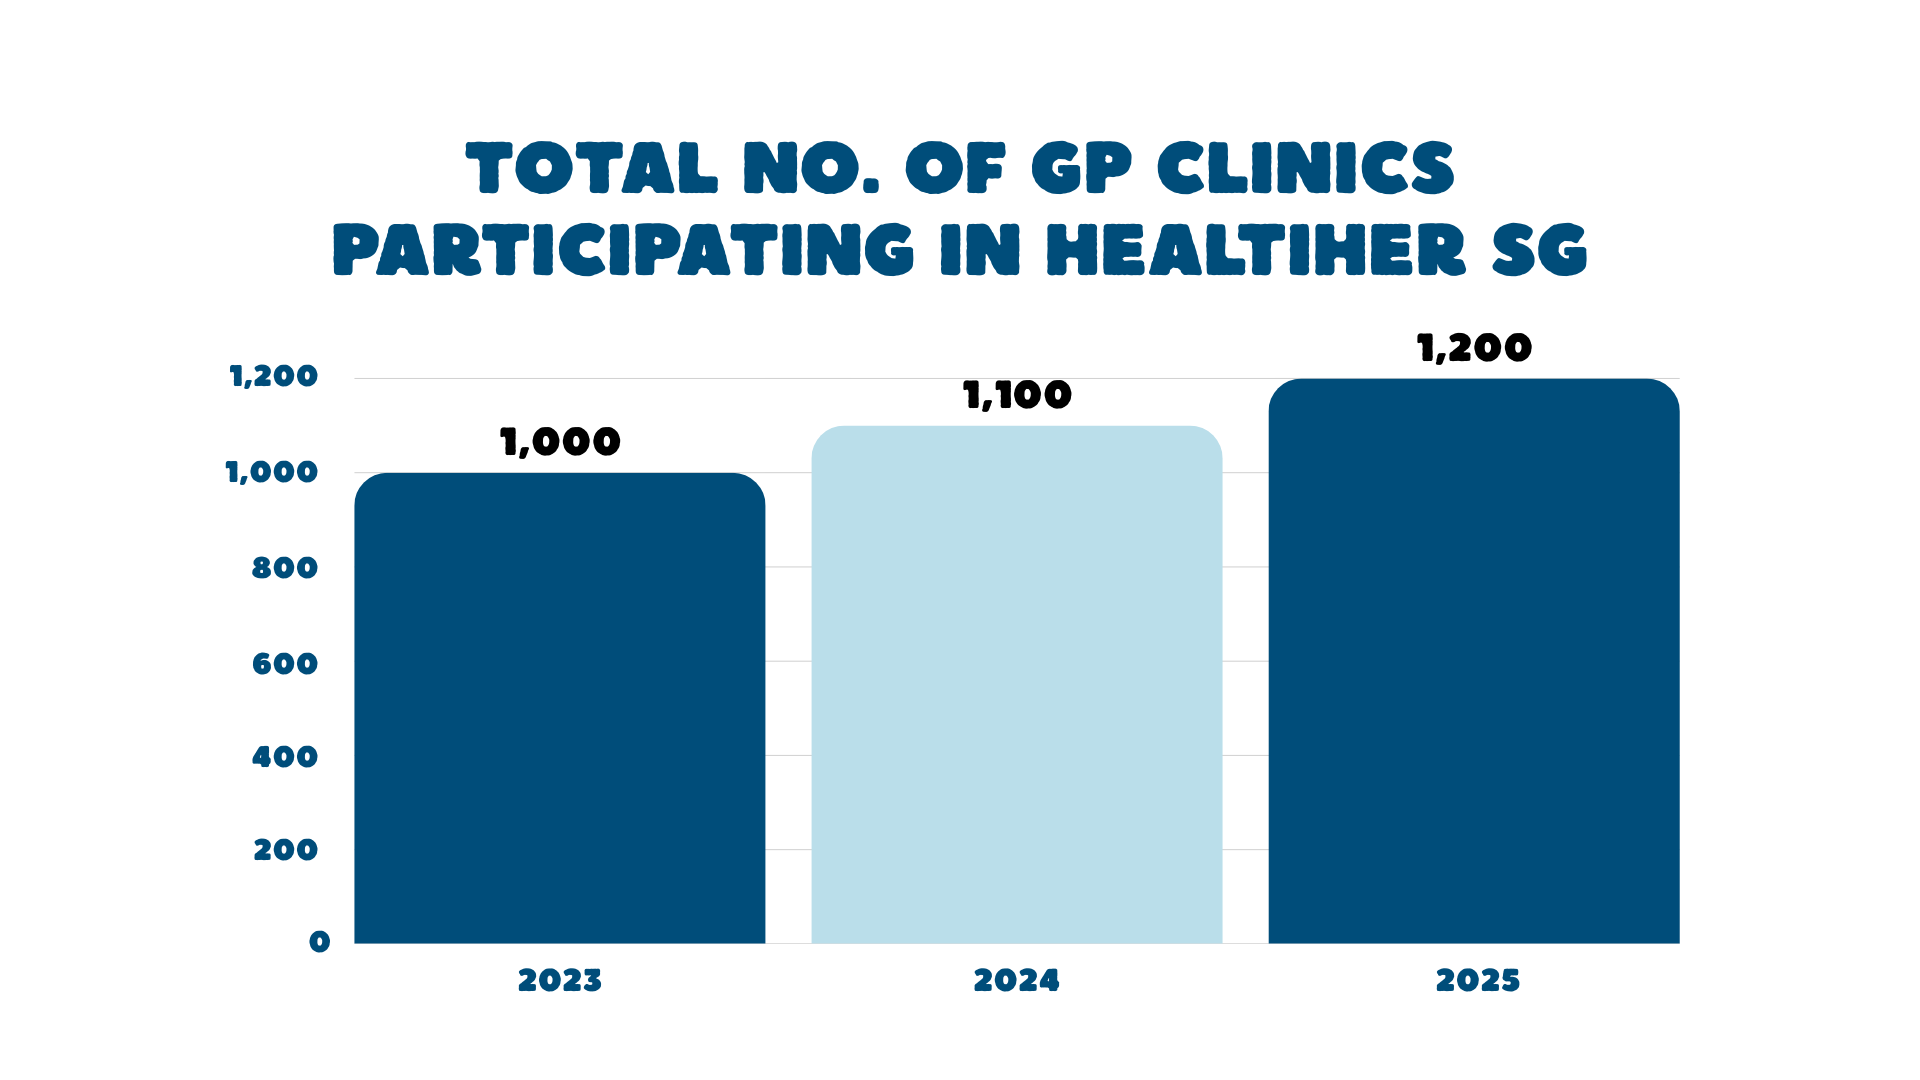
Healthcare Capacity
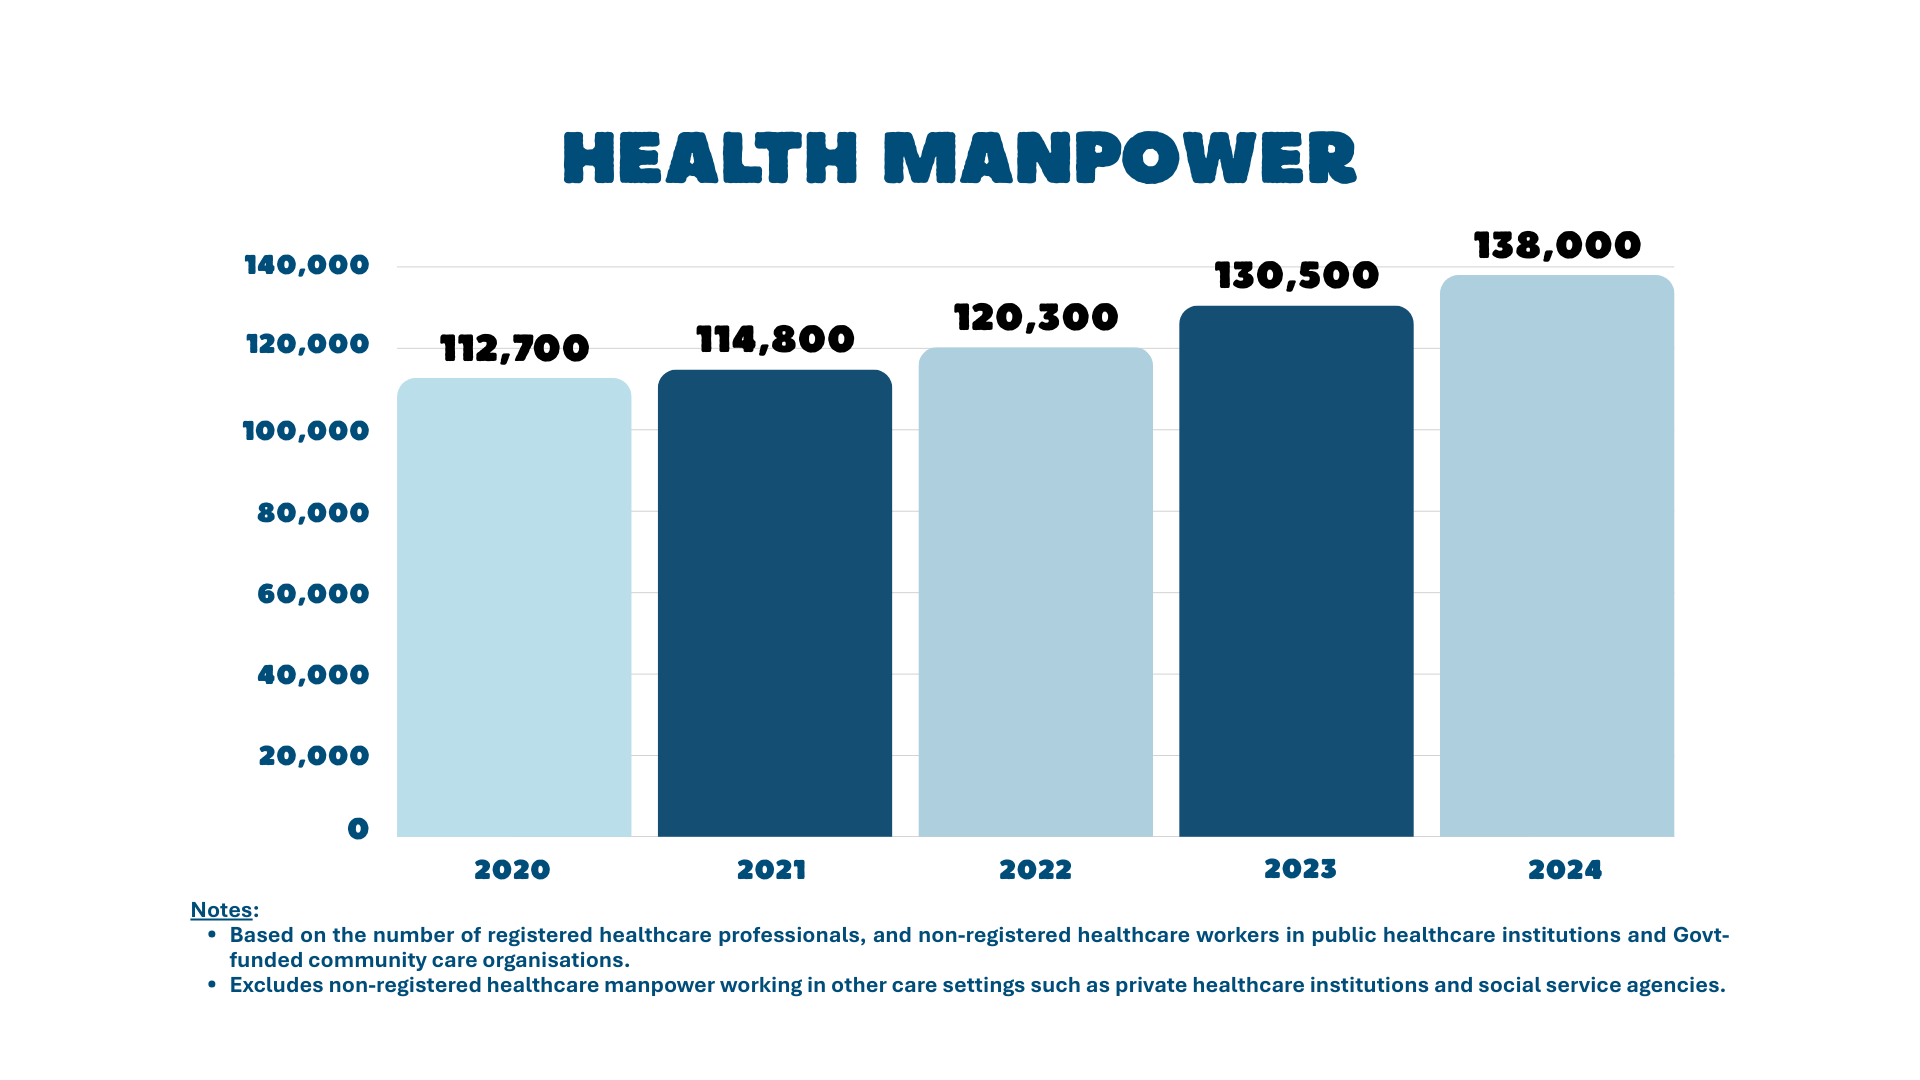
Total Healthcare Workforce
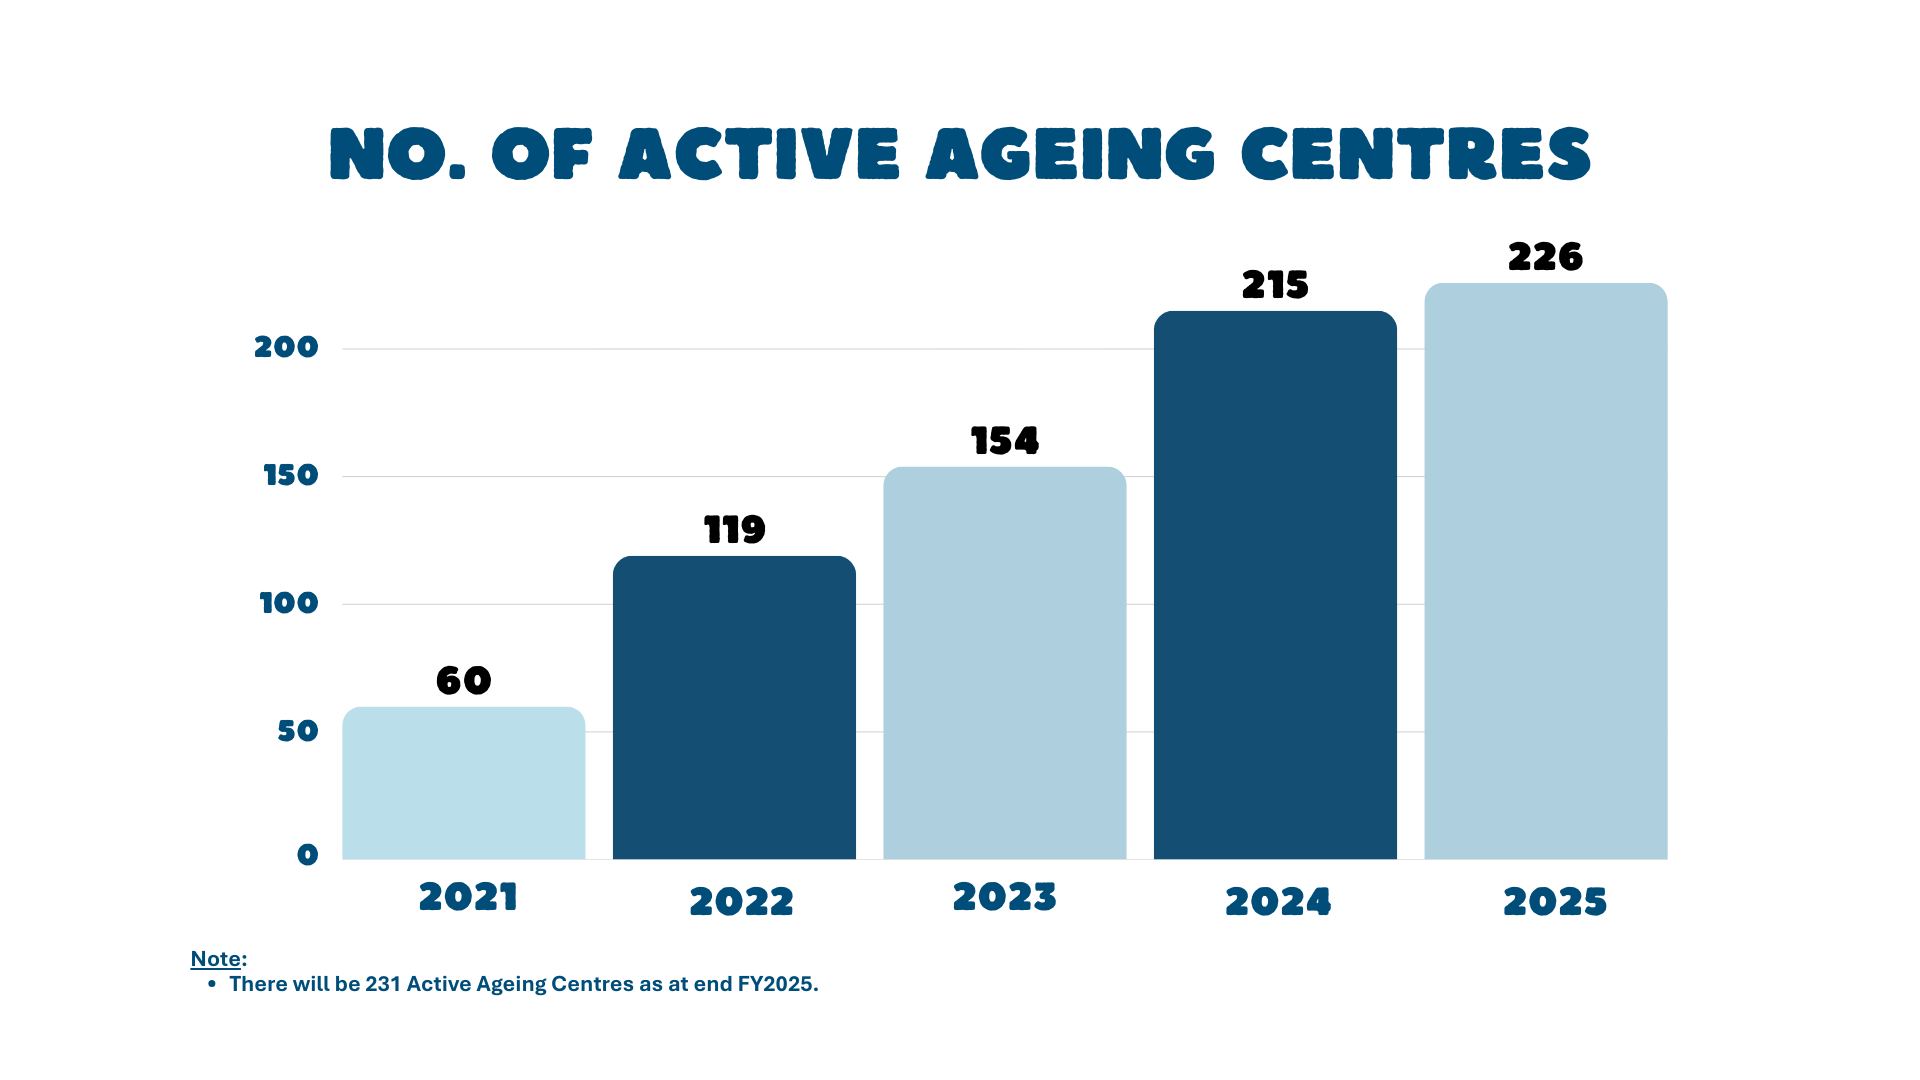
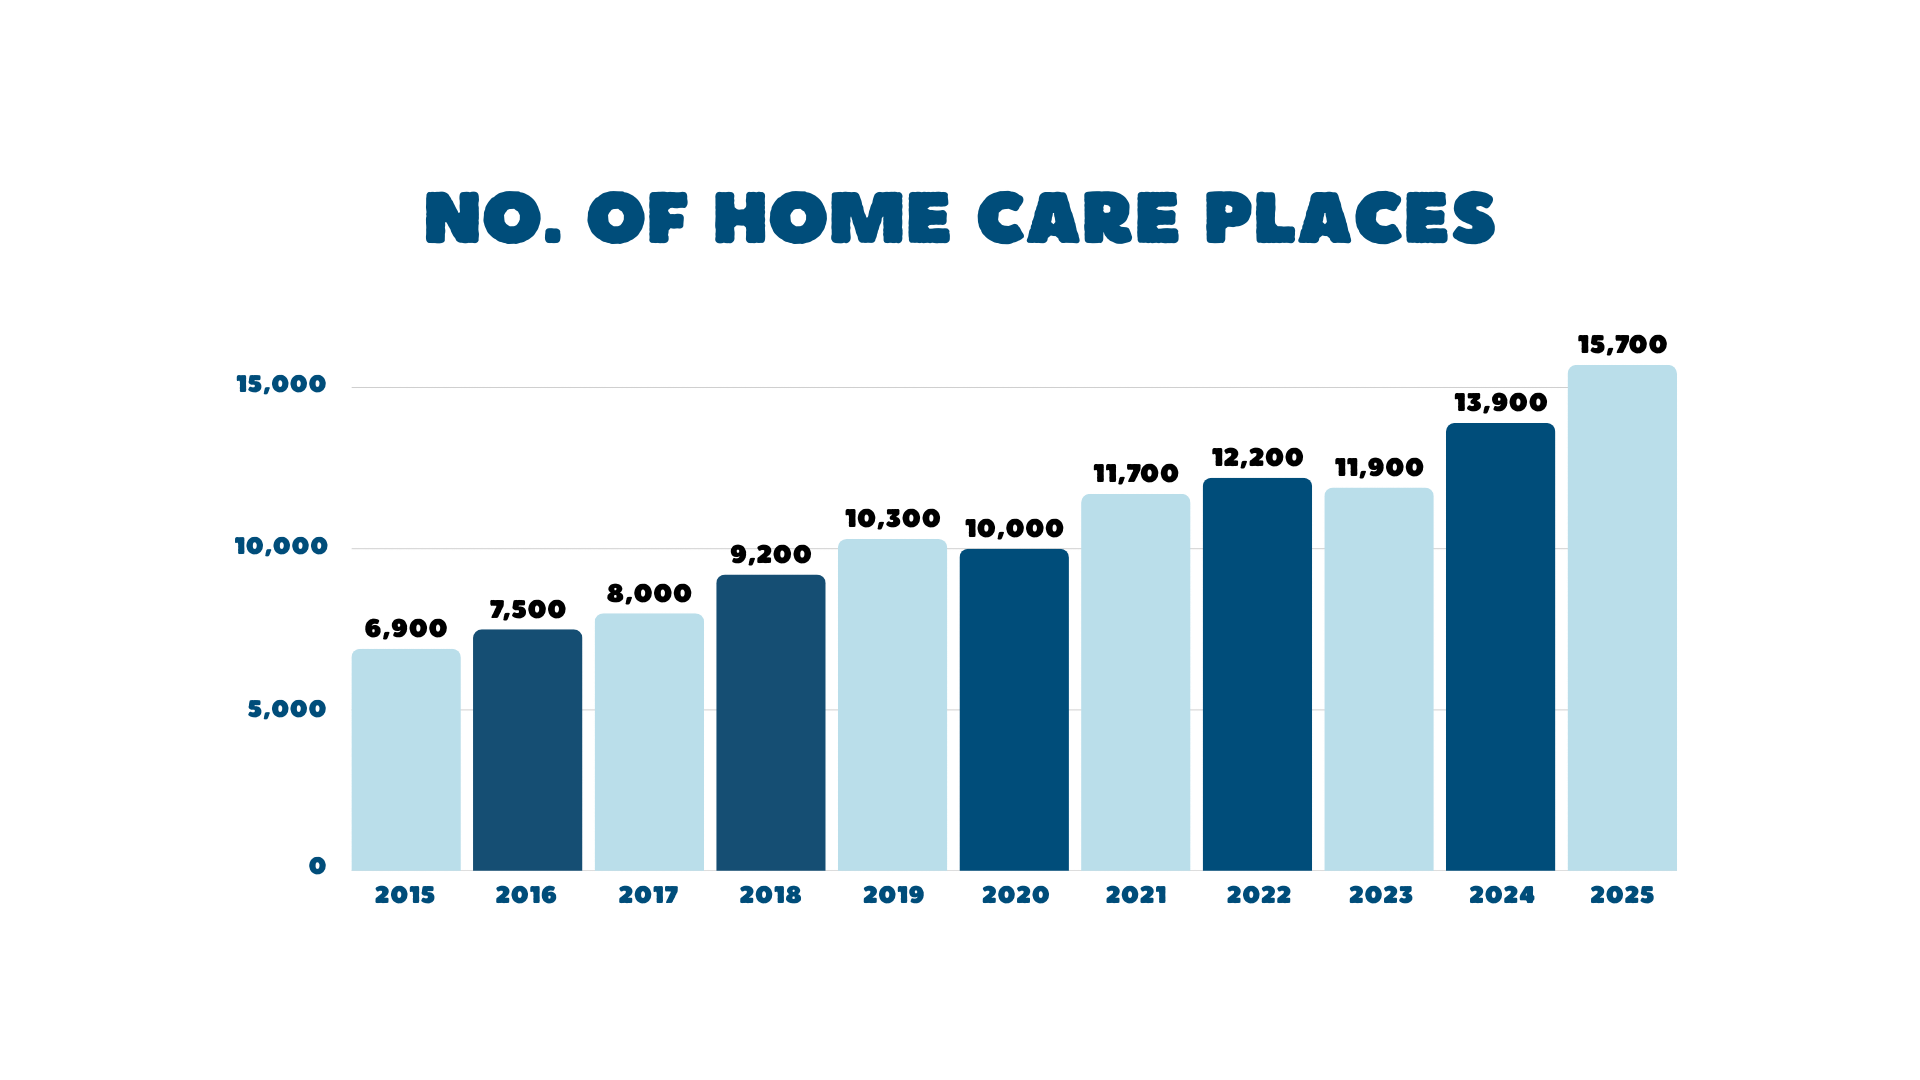
Community Care for Seniors

.png)
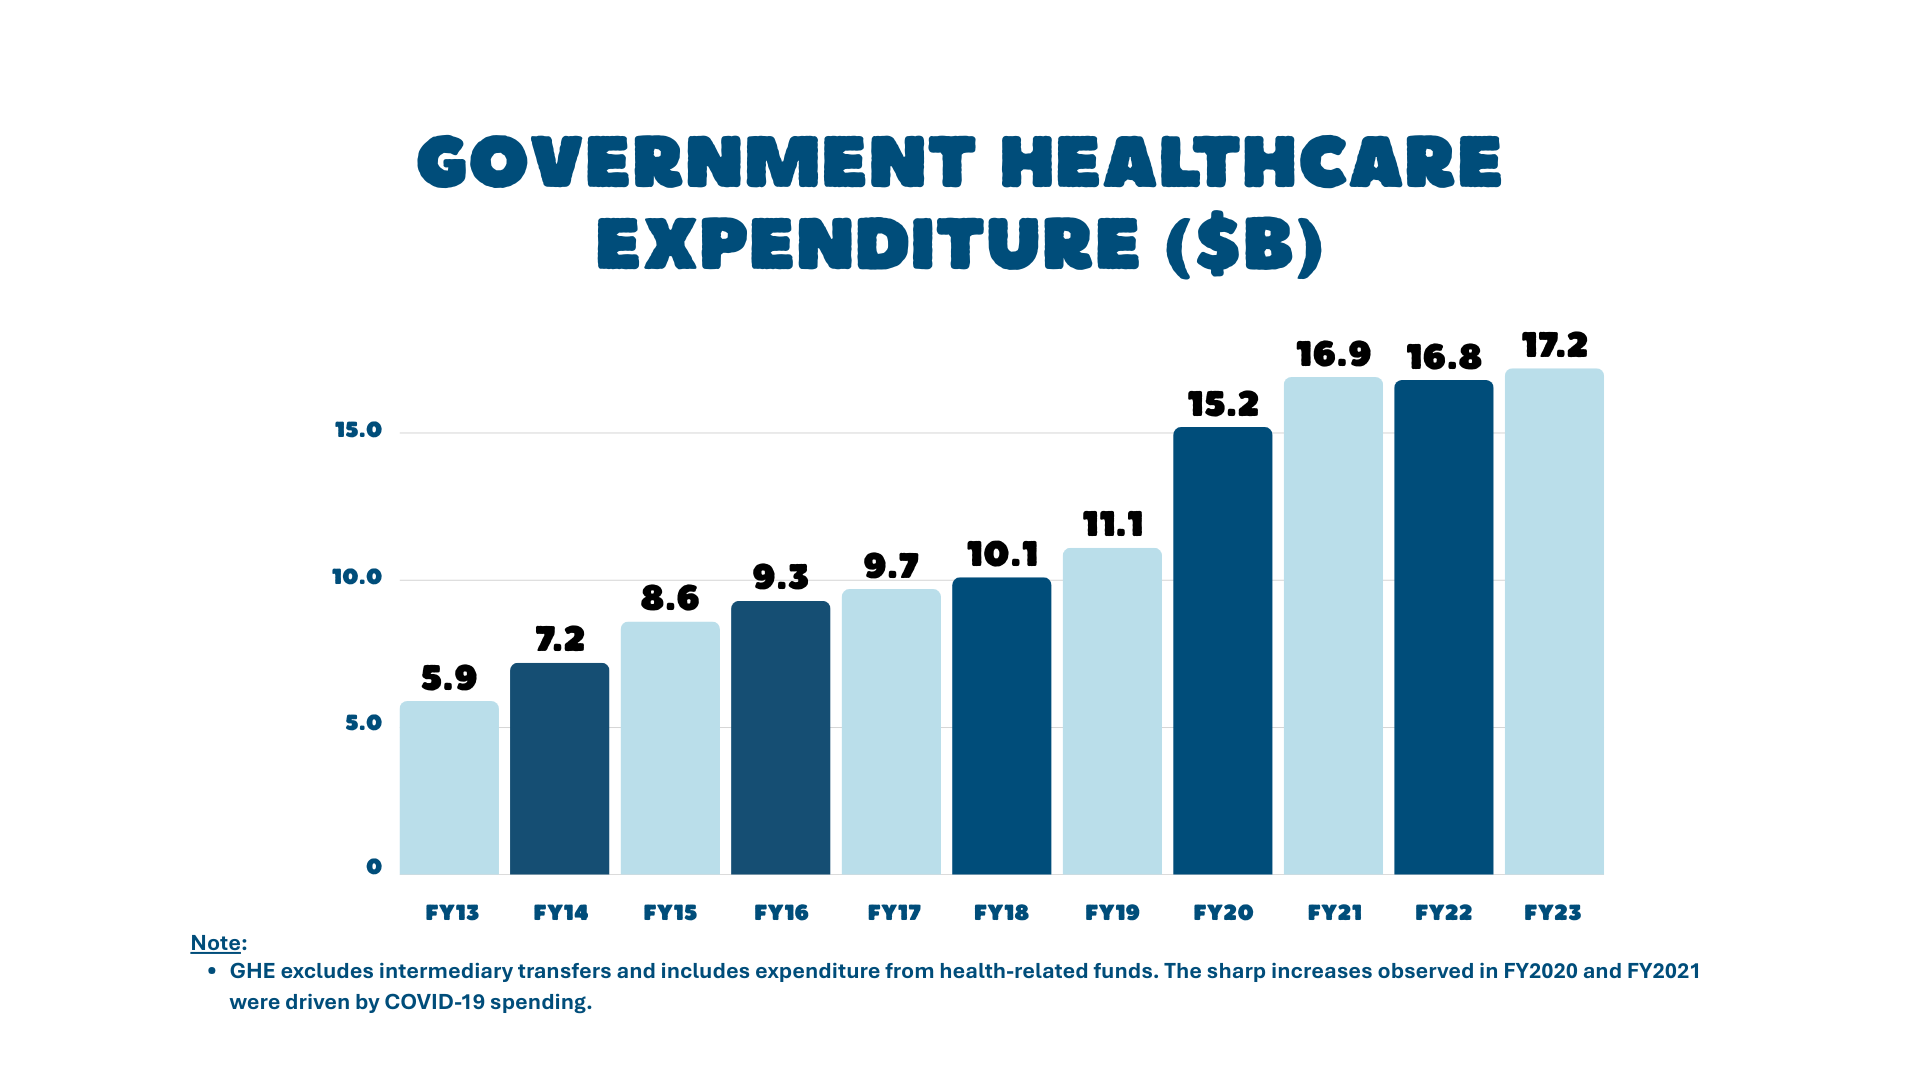
Healthcare Expenditure
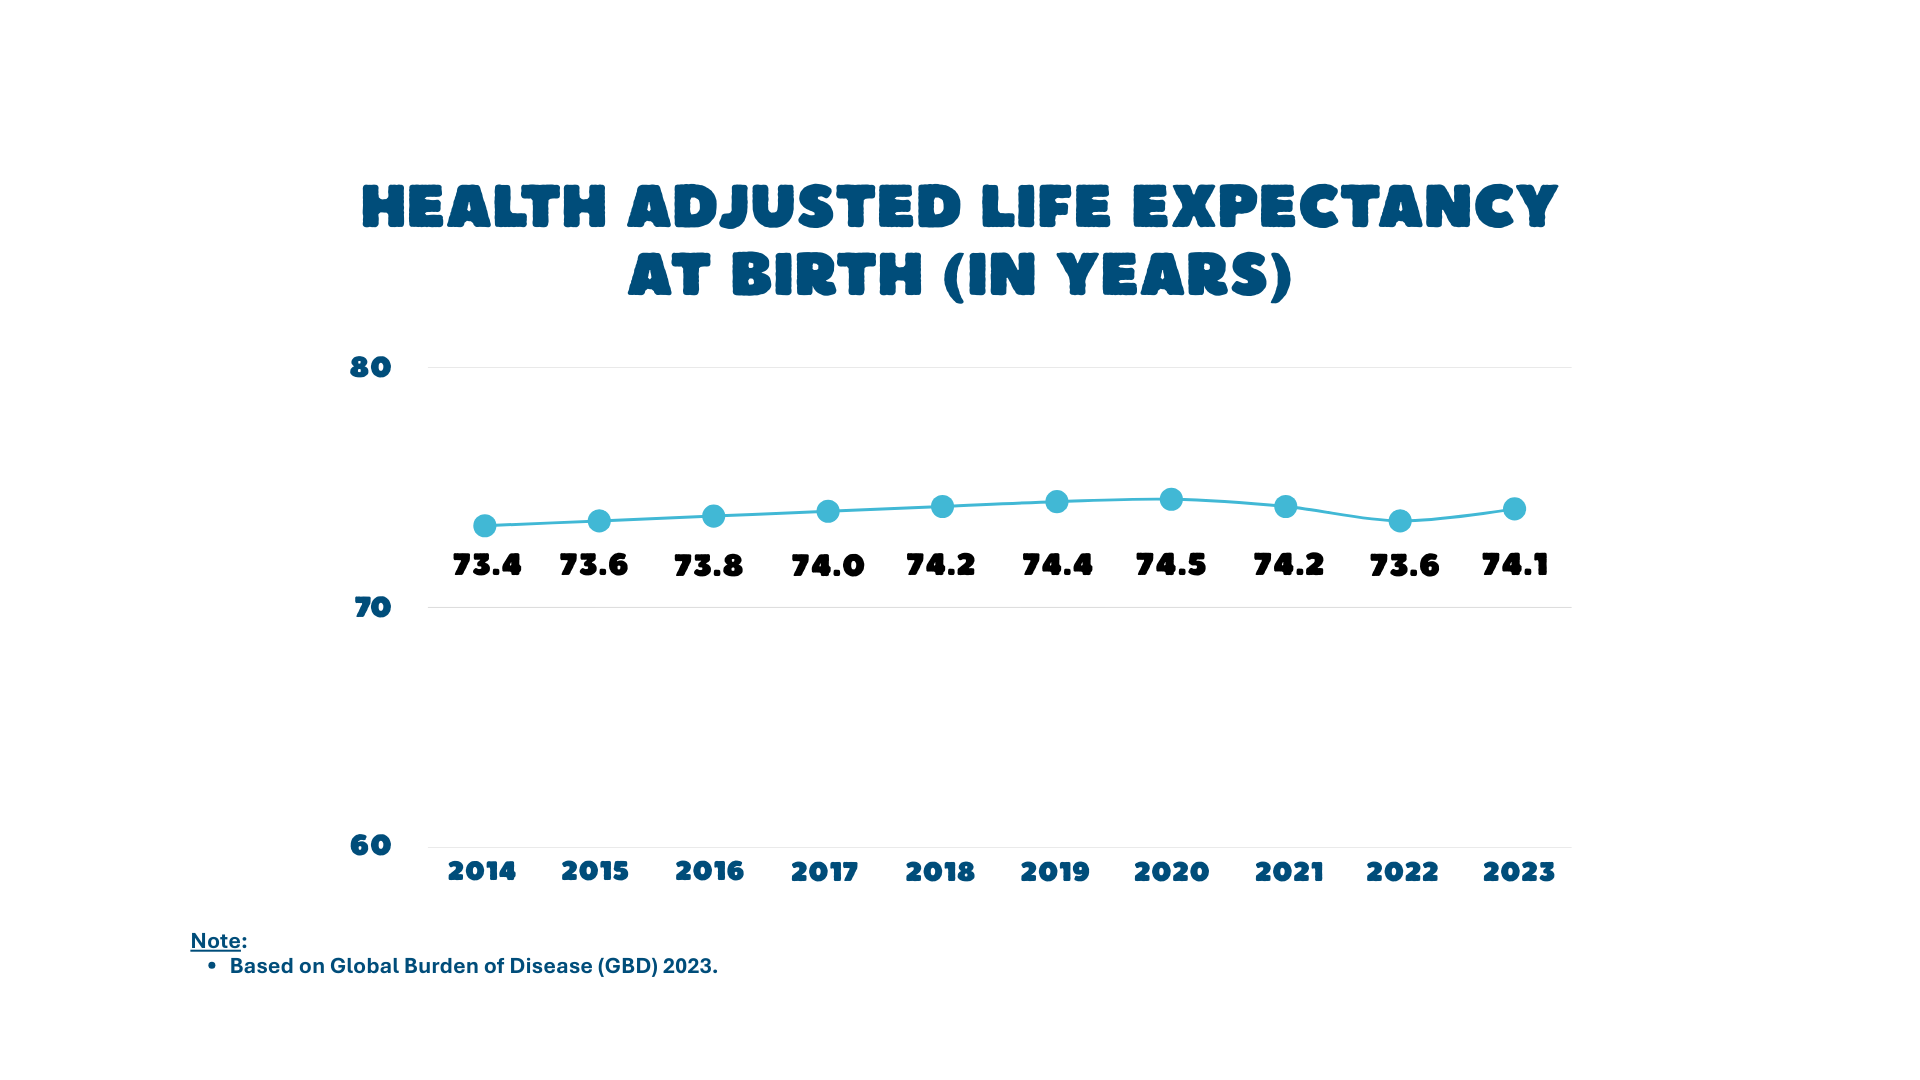
Population Health
Call the 24/7 ScamShield Helpline at 1799 if you are unsure if something is a scam.
Overview of our healthcare system